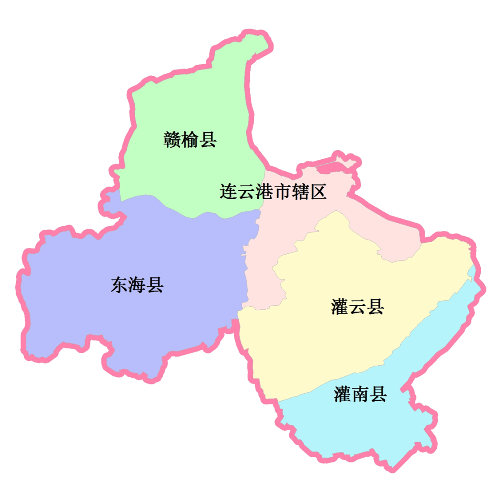
Basic Data

| Information | Data | Change Rate | Historical Trend |
| Population | 440.69(104) |  0.5% 0.5% |
|
| GDP | 1603.42(108 RMB) |  13.7% 13.7% |
|
| Secondary/Tertiary Industrial Production Ratio | 1.159 |  1.8% 1.8% |
|
| Primary Coal Consumption Ratio | -% | -- | |
| Registered Vehicles | -(per hundred people) | -- |
Yangtze River DeltaJiangsuZhejiangXuzhouSuqianHuaianYanchengYangzhouTaizhouNantongNanjingZhenjiangChangzhouWuxiSuzhou
| API | Change Rate |
-- |
-- |
| Smog Days | Percentage | Blue Sky Days | Percentage | Change Rate |
--Day |
-- | 332Day | 90.7% |  0.3% 0.3% |
| Air Quality | |||
| Type of Pollutant | Air Quality Status | Yearly (mg/m3) | Change Rate |
| PM2.5 | -- | -- | |
| PM10 | 0.093 |  3.3% 3.3% |
|
| SO2 | 0.031 |  20.5% 20.5% |
|
| NO2 | 0.034 |  36.0% 36.0% |
|
| O3 | -- | -- | |
| CO | -- | -- | |
| Emission Data | ||
| Type of Pollutant | Emissions(10,000 Tons) | Change Rate |
| SO2 | 4.72 |  9.8% 9.8% |
| NOx | 4.96 |  2.7% 2.7% |
| 烟(粉)尘 | 2.07 |  25.5% 25.5% |